The following figure shows credit demand and credit supply curves.
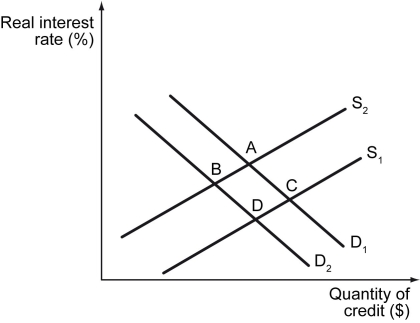
-Refer to the figure above.Assume that at point A the real interest rate is 8 percent,the inflation rate is 3 percent,and the total quantity of credit in the market at equilibrium (Q*) is equal to $100 million.Which of the following could be true about point B?
A) The rate of inflation is 2 percent, and the real interest rate is 6 percent.
B) The nominal interest rate is 5 percent, and the inflation rate is 6 percent.
C) The real interest rate is 8 percent, and the rate of inflation is 4 percent.
D) The nominal interest rate is 11 percent, and the inflation rate is 3 percent.
Correct Answer:
Verified
Q57: Everything else remaining unchanged,what is likely to
Q58: Assuming all else equal,any change that causes
Q59: Which of the following statements is true?
A)
Q60: Which of the following statements is true?
A)
Q61: Which of the following statements is true?
A)
Q63: At the equilibrium rate of interest,_.
A) the
Q64: Illustrate graphically how the equilibrium quantity of
Q65: What is the loanable funds market? What
Q66: The following figure shows two credit demand
Q67: Everything else remaining unchanged,what is likely to
Unlock this Answer For Free Now!
View this answer and more for free by performing one of the following actions

Scan the QR code to install the App and get 2 free unlocks

Unlock quizzes for free by uploading documents