The table below shows the quantities of rice and wheat that two countries can produce in a year if they specialize in the production of each good.
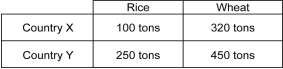
-Refer to the table above.The opportunity cost of producing 1 ton of wheat in Country X is ________.
A) 0.31 tons of rice
B) 3.1 tons of rice
C) 32 tons of wheat
D) 320 tons of wheat
Correct Answer:
Verified
Q35: Scenario: Consider two economies, Beta and Zeta.
Q36: Scenario: There are two workers in a
Q37: The table below shows the quantities of
Q38: Scenario: There are two workers in a
Q39: Scenario: Mike and John work as waiters
Q41: International trade is driven by _.
A) absolute
Q42: Comparative advantage and international trade are driven
Q43: Scenario: A shoe manufacturer has factories in
Q44: Scenario: There are two workers in a
Q45: Scenario: A shoe manufacturer has factories in
Unlock this Answer For Free Now!
View this answer and more for free by performing one of the following actions

Scan the QR code to install the App and get 2 free unlocks

Unlock quizzes for free by uploading documents