The following figure shows the demand and supply curve for dollars against the rupee.
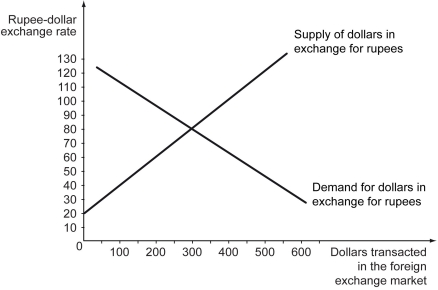
-Refer to the figure above.The equilibrium exchange rate in this case is ________.
A) 20 rupees per dollar
B) 40 rupees per dollar
C) 80 rupees per dollar
D) 130 rupees per dollar
Correct Answer:
Verified
Q53: The supply curve of dollars in the
Q54: The following figure shows the demand and
Q55: Everything else being equal,a depreciation of the
Q56: What will be the likely impact of
Q57: The demand for dollars slopes downward because
Q59: Everything else being equal,a depreciation of the
Q60: In the foreign exchange market,the higher the
Q61: If an overvalued currency is allowed to
Q62: If a country wants to keep a
Q63: If a country wants to keep its
Unlock this Answer For Free Now!
View this answer and more for free by performing one of the following actions

Scan the QR code to install the App and get 2 free unlocks

Unlock quizzes for free by uploading documents