Figure 3-5 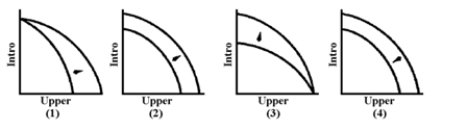
-At present, faculty in the Economics Department teach introductory and upper-level courses.Which graph in Figure 3-5 represents the change in the production possibilities of the Economics Department after a policy of using graduate students in addition to faculty to teach introductory sections was implemented?
A) 1
B) 2
C) 3
D) 4
Correct Answer:
Verified
Q200: If the production possibilities frontier for two
Q201: Suppose the U.S.government has an annual budget
Q202: What would be the opportunity cost of
Q203: Which of the following is a listing
Q204: Figure 3-4 Q206: If the economy of Gwondanaland is growing Q207: Is faster economic growth unambiguously better? Q208: Figure 3-3 Q209: Economists define efficiency as Q210: Figure 3-4 Unlock this Answer For Free Now! View this answer and more for free by performing one of the following actions Scan the QR code to install the App and get 2 free unlocks Unlock quizzes for free by uploading documents![]()
A)No, because
![]()
A)output maximization.
B)the absence of![]()

