Figure 10-5 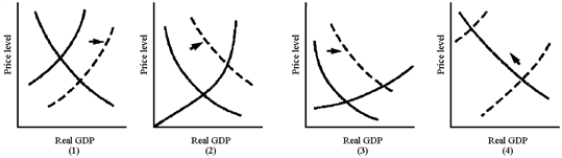
-In Figure 10-5, which graph best illustrates the situation of an economy with high unemployment that experiences an increase in investment spending?
A) (1)
B) (2)
C) (3)
D) (4)
Correct Answer:
Verified
Q185: The years 2002 through 2007 can be
Q186: The usual results of an adverse supply
Q187: The self-correcting mechanism would be expected to
Q188: Figure 10-6 Q189: The 2002-2008 OPEC price increases caused by Q191: Which of the following events will lead Q192: A outward shift of the aggregate supply Q193: The primary effect of OPEC actions in Q194: Self-correcting mechanism reveals that Q195: Figure 10-6
![]()
A)real wages will increase
![]()
Unlock this Answer For Free Now!
View this answer and more for free by performing one of the following actions

Scan the QR code to install the App and get 2 free unlocks

Unlock quizzes for free by uploading documents