Figure 10-5 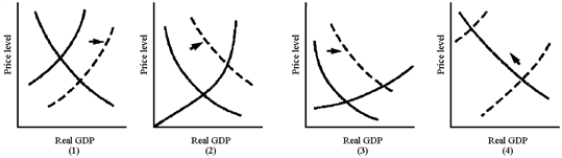
-In Figure 10-5, which graph best illustrates the situation of an economy reacting to an inflationary gap through an increase in wage levels?
A) (1)
B) (2)
C) (3)
D) -(4)
Correct Answer:
Verified
Q178: A common error of business managers is
Q179: Which of the following is evidence of
Q180: When economists refer to the economy's self-correcting
Q181: Economists believed that the U.S.economy had a
Q182: How are aggregate supply and stagflation related?
A)Stagflation
Q184: Figure 10-5 Q185: The years 2002 through 2007 can be Q186: The usual results of an adverse supply Q187: The self-correcting mechanism would be expected to Q188: Figure 10-6![]()
![]()
Unlock this Answer For Free Now!
View this answer and more for free by performing one of the following actions

Scan the QR code to install the App and get 2 free unlocks

Unlock quizzes for free by uploading documents