Figure 11-2
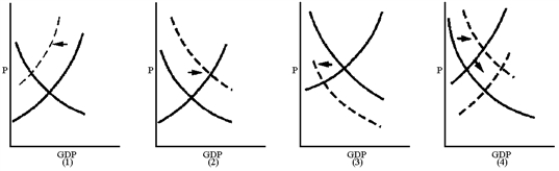
-Which graph in Figure 11-2 best reflects a Keynesian's view of the short-run impact of an increase in the personal income tax rate?
A) 1
B) 2
C) 3
D) 4
Correct Answer:
Verified
Q158: One of the objectives of supply-side policies
Q159: If a "liberal" wanted to increase aggregate
Q160: A major complication with fiscal policy to
Q161: Reductions in the personal income tax, often
Q162: A reduction in the capital gains tax,
Q164: One objection to supply-side tax cuts is
Q165: Figure 11-2 Q166: Critics of supply-side economics argue that Q167: Figure 11-2 Q168: Figure 11-2 Unlock this Answer For Free Now! View this answer and more for free by performing one of the following actions Scan the QR code to install the App and get 2 free unlocks Unlock quizzes for free by uploading documents
![]()
A)tax cuts
![]()
![]()

