Figure 11-3
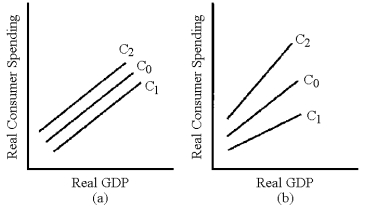
-In Figure 11-3,which line represents the change in the consumption schedule caused by a cut in fixed taxes?
A) C1 in graph (a)
B) C2 in graph (a)
C) C1 in graph (b)
D) C2 in graph (b)
Correct Answer:
Verified
Q186: When government increases a fixed tax, consumption
Q191: In the short run, tax cuts that
Q196: Table 11-1 Q197: A Keynesian economist would expect a supply-side Q199: Most economists seem to agree that cutting Q202: What is the difference between tax cuts Q203: Why did President George W.Bush feel the Q204: Why is the personal income tax considered Q205: Discuss some of the general conclusions arrived Q210: Why did President Obama want to repeal![]()
Unlock this Answer For Free Now!
View this answer and more for free by performing one of the following actions

Scan the QR code to install the App and get 2 free unlocks

Unlock quizzes for free by uploading documents