Figure 11-3
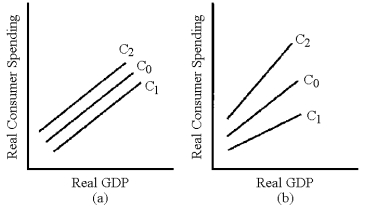
-In Figure 11-3,which line represents the change in the consumption schedule caused by an increase in the residential property tax?
A) C1 in graph (a)
B) C2 in graph (a)
C) C1 in graph (b)
D) C2 in graph (b)
Correct Answer:
Verified
Q184: Figure 11-3 Q185: Table 11-1 Q188: Why does the numerical value of the Q188: Figure 11-3 Q189: The Reagan tax cuts of the 1980s Q195: Explain why a change in income tax Q198: Define the following terms and explain their Q199: There is some agreement between the beliefs Q200: Which of the following conclusions about supply-side Q206: Explain how a "conservative" and a "liberal" Unlock this Answer For Free Now! View this answer and more for free by performing one of the following actions Scan the QR code to install the App and get 2 free unlocks Unlock quizzes for free by uploading documents
![]()
![]()
![]()
A)had

