Multiple Choice
Figure 20-2
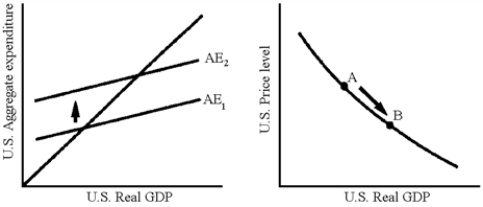
-Which of the following explains the movements in Figure 20-2?
A) an increase in U.S.imports
B) a decrease in U.S.exports
C) an increase in U.S.exports
D) a decrease in U.S.net exports
Correct Answer:
Verified
Related Questions
Q63: Assume that Country X and Country Y
Q64: Theoretically, when a currency depreciates one can
Q67: Which of the following would lead to
Q68: An increase in the price level in
Unlock this Answer For Free Now!
View this answer and more for free by performing one of the following actions

Scan the QR code to install the App and get 2 free unlocks

Unlock quizzes for free by uploading documents