Figure 20-5
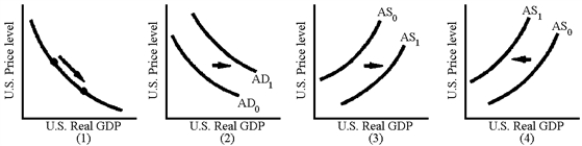
-Which of the graphs in Figure 20-5 are consistent with an appreciation of the U.S.dollar caused by an increase in U.S.interest rates?
A) 1
B) 2
C) 3
D) 4
Correct Answer:
Verified
Q82: What are the economic effects of a
Q100: If the demand effect dominates during a
Q103: For a major country with extensive capital
Q105: In an open economy, an increase in
Q107: A decline in interest rates tends to
Q110: The reason that higher interest rates reduce
Q111: What important lesson did American economists learn
Q115: International trade tends to lower the value
Q116: International capital flows are purchases and sales
Q117: Expansionary fiscal policy in an open economy
A)leads
Unlock this Answer For Free Now!
View this answer and more for free by performing one of the following actions

Scan the QR code to install the App and get 2 free unlocks

Unlock quizzes for free by uploading documents