Figure 20-5
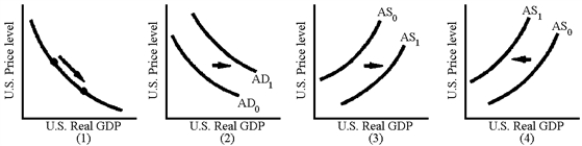
-Which of the graphs in Figure 20-5 are consistent with a depreciation of the U.S.dollar and an increase in net exports caused by a decrease in U.S.interest rates?
A) 1
B) 2
C) 3
D) 4
Correct Answer:
Verified
Q101: A fall in the domestic interest rate
Q102: A rise in the domestic interest rate
Q106: A currency appreciation
A)reduces aggregate demand and increases
Q107: A decline in interest rates tends to
Q110: For a major country with extensive capital
Q110: The reason that higher interest rates reduce
Q113: A currency depreciation
A)reduces aggregate demand and increases
Q115: International trade tends to lower the value
Q116: International capital flows are purchases and sales
Q118: Because the United States is highly integrated
Unlock this Answer For Free Now!
View this answer and more for free by performing one of the following actions

Scan the QR code to install the App and get 2 free unlocks

Unlock quizzes for free by uploading documents