Consider the thermoacidophile,Sulfolobus acidocaldarius.Which of the following graphs most accurately depicts the expected temperature and pH profiles of its enzymes? (Note: The horizontal axes of these graphs are double,with pH above and temperature below.) 
A) 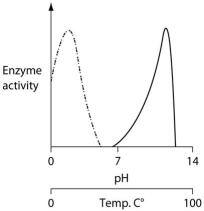
B) 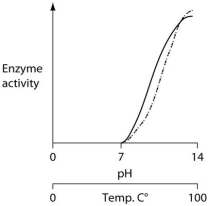
C) 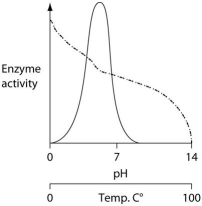
D) 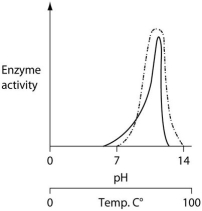
Correct Answer:
Verified
Q41: The figure below depicts changes to the
Q42: Use the information in the following paragraph
Q45: Use the information in the following paragraph
Q48: The figure below depicts changes to the
Q48: Use the information in the following paragraph
Q55: Figure 27.2 depicts changes to the amount
Q56: Use the information in the following paragraph
Q71: The following table depicts characteristics of five
Q72: Use the following information to answer the
Q80: Use the information in the following paragraph
Unlock this Answer For Free Now!
View this answer and more for free by performing one of the following actions

Scan the QR code to install the App and get 2 free unlocks

Unlock quizzes for free by uploading documents