Which graph below best represents the way that density changes over time in a physoclistus fish and in a physostomus fish,respectively? 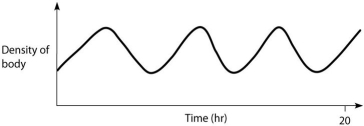
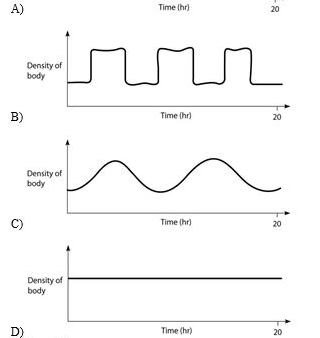
A) A and B
B) B and A
C) B and C
D) C and B
E) D and B
Correct Answer:
Verified
Q61: The following questions refer to the phylogenetic
Q67: In coelacanths, a swim bladder is present,
Q73: The following questions refer to the phylogenetic
Q74: The following questions refer to the phylogenetic
Q75: If a ray-finned fish is to both
Q80: The following questions refer to the description
Q88: The following questions refer to the description
Q94: The following questions refer to the description
Q95: The following questions refer to the description
Q96: The following questions refer to the description
Unlock this Answer For Free Now!
View this answer and more for free by performing one of the following actions

Scan the QR code to install the App and get 2 free unlocks

Unlock quizzes for free by uploading documents