Which of the following graphs illustrates the growth curve of a small population of rodents that has grown to reach a static carrying capacity?
A) 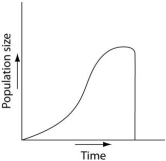
B) 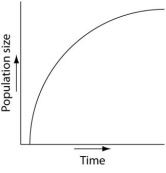
C) 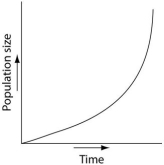
D) 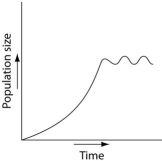
E) 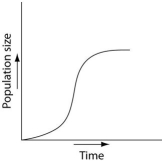
Correct Answer:
Verified
Q50: Use the survivorship curves in Figure 53.1
Q57: Which statement is true with regard to
Q60: Use the survivorship curves in Figure 53.1
Q62: The following questions refer to Figure 53.3,
Q62: The following questions refer to the description
Q73: Please read the paragraph below and review
Q73: Refer to Figure 53.4 and then answer
Q75: Please read the paragraph below and review
Q80: Which of the following graphs illustrates the
Q82: A recent study of ecological footprints concluded
Unlock this Answer For Free Now!
View this answer and more for free by performing one of the following actions

Scan the QR code to install the App and get 2 free unlocks

Unlock quizzes for free by uploading documents