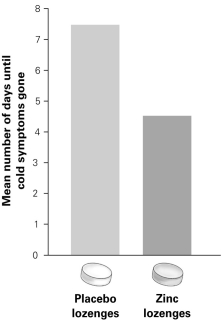
-According to the graph, how did the number of days with cold symptoms compare for people taking placebo and zinc lozenges?
A) People taking the placebo had cold symptoms for three more days than people taking the zinc lozenges.
B) People taking the placebo had cold symptoms for seven more days than people taking the zinc lozenges.
C) People taking the zinc lozenges had cold symptoms for three more days than people taking the placebo.
D) People taking the zinc lozenges had cold symptoms for seven more days than people taking the placebo.
Correct Answer:
Verified
Q62: Q63: In science, what would an individual's personal Q64: What type of scientific information would include Q65: What does statistical analysis of experimental results![]()
Unlock this Answer For Free Now!
View this answer and more for free by performing one of the following actions

Scan the QR code to install the App and get 2 free unlocks

Unlock quizzes for free by uploading documents