The following question are based on the following graph. The curves D and S represent the market demand and supply curves for farm products in 1960. The curves D₁ and S₁ represent the market demand and supply curves for farm products in 2000. It is supposed that there were no support programs in either year.
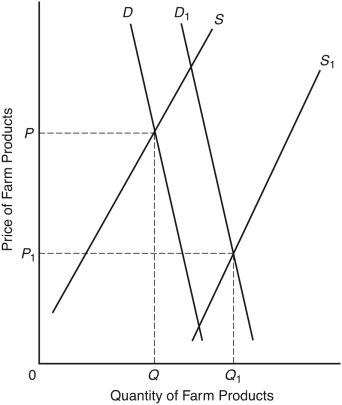
-The steepness of the two demand curves can best be explained by the fact that
A) the quantity of food demanded does not vary much with the price of food because food is a necessity.
B) the consumption of food per capita faces natural limits and hence responds by only a small amount to changes in per capita income.
C) farmers have only limited control over their outputs.
D) there has been rapid technological change in agriculture.
E) poor farmers have been slow to leave the farming industry.
Correct Answer:
Verified
Q39: Under which of the following price elasticities
Q40: When a demand curve is price inelastic
A)
Q41: The nation's farm problem follows from
A) a
Q42: Cross elasticity of demand measures the
A) percentage
Q43: The sensitivity of the quantity demanded to
Q45: One way to define luxuries (as opposed
Q46: The following question are based on the
Q47: Which of the following demand curves would
Q48: If the income elasticity of demand for
Q49: Luxuries are distinguished from necessities by the
A)
Unlock this Answer For Free Now!
View this answer and more for free by performing one of the following actions

Scan the QR code to install the App and get 2 free unlocks

Unlock quizzes for free by uploading documents