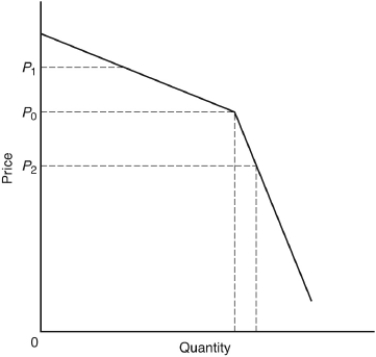
-This diagram is used to illustrate
A) why an oligopoly firm is unwilling to raise its price above P₀ to P₁ or lower it from P₀ to P₂
B) the "phases of the moon" pricing process used by the electrical industry.
C) the difference between dominant firm price leadership raising the price from P₀ to P₁ and barometric firm price leadership reducing the price from P₀3. to P₂.
D) long-run equilibrium in a perfectly competitive market.
E) the process by which a cartel sets prices and divides up the market among its members.
Correct Answer:
Verified
Q63: The condition whereby firms aggressively undercut one
Q64: One recent criticism of the airline industry
Q65: The rule of reason doctrine prevailed during
Q66: U.S.antitrust laws and their enforcement
A) reflect the
Q67: From the firm's point of view,the greatest
Q68: Antitrust action is the responsibility of the
A)
Q69: One of the first U.S.presidents to actively
Q70: Antitrust action against the American Telephone and
Q71: The notion advanced by the Supreme Court
Q73: The two approaches to antitrust policy are
Unlock this Answer For Free Now!
View this answer and more for free by performing one of the following actions

Scan the QR code to install the App and get 2 free unlocks

Unlock quizzes for free by uploading documents