The following question are based on the following diagram:
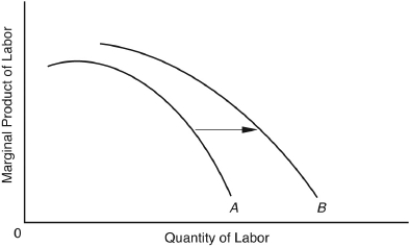
-The shift in the marginal product of labor curve shown in the diagram might be caused by
A) population growth.
B) an increase in the price of food.
C) a declining average product of labor.
D) technological change.
E) a decreasing total product of labor.
Correct Answer:
Verified
Q28: Empirical evidence from industrialized countries on the
Q29: The dire predictions of the 1974 Club
Q30: The marginal product of capital decreases because
Q31: The purpose of the British Corn Laws
Q32: If a society attempts to increase output
Q34: Both Malthus and Ricardo erred in expecting
Q35: Ricardo,in his work on income distribution,emphasized the
Q36: The Club of Rome study was concerned
Q37: Holding technology constant,increases in investment in plant
Q38: Improvements in agricultural technology will
A) raise the
Unlock this Answer For Free Now!
View this answer and more for free by performing one of the following actions

Scan the QR code to install the App and get 2 free unlocks

Unlock quizzes for free by uploading documents