In a study that investigated the relationship between television watching habits and work productivity, researchers asked respondents three items related to their TV watching:
a. Item 1: On an average week, do you watch television?
b. Item 2: How often do you watch television with others (rather than by yourself)?
c. Item 3: How many hours per day do you watch television?
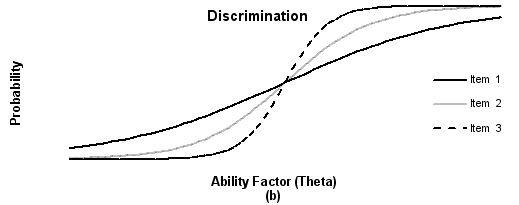
However, when the researchers ran their item response analyses, they realized they never learned how to interpret them - so they called you. Your task is to describe what is happening in the figure below. Specifically: (a) briefly describe what we are looking at - what do "discrimination" and "ability (or theta)" represent in the context of the study? (b) interpret the three curves for someone at theta = -2, and describe to the researchers what that means; (c) describe how we would determine whether a curve reflects "good" discrimination; and (d) based on that information, suggest to the researchers which item(s) they should keep and which item(s) they should remove, and be sure to explain why you are offering those suggestions.
Correct Answer:
Verified
Q1: Explain the relationship between true score, observed
Q2: Compare and contrast the test-retest and parallel
Q3: Discuss some of the different ways that
Q4: What are some advantages and unique possibilities
Q6: _(a)_ is the degree of relationship between
Q7: A person's observed response pattern on any
Q8: A person's observed response pattern on any
Q9: In an experiment on teen aggression and
Q10: Which of the following techniques are specifically
Q11: The concept of reliability includes the following
Unlock this Answer For Free Now!
View this answer and more for free by performing one of the following actions

Scan the QR code to install the App and get 2 free unlocks

Unlock quizzes for free by uploading documents