Which of the following graphs reflect possible outcomes of a growth curve modeling design? (circle all that apply)
A) 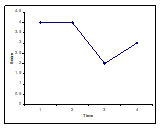
B) 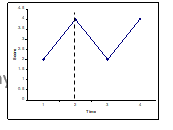
C) 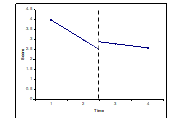
D) 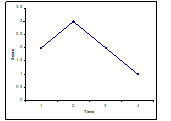
Correct Answer:
Verified
Q8: Which of the following is true regarding
Q9: Which of the following techniques is an
Q10: With propensity scores analyses, the difference between
Q11: Propensity scoring is often preferred when using
Q12: Not all social programs are amenable to
Q14: There are many types of longitudinal or
Q15: The "Stroop" Task is an example of:
A)
Q16: If a participant's eye gaze is directed
Q17: Research that uses recall tasks:
A) is better
Q18: Having participants complete a series of sentence
Unlock this Answer For Free Now!
View this answer and more for free by performing one of the following actions

Scan the QR code to install the App and get 2 free unlocks

Unlock quizzes for free by uploading documents