The figure given below represents the business cycle of an economy.?Figure 7.1
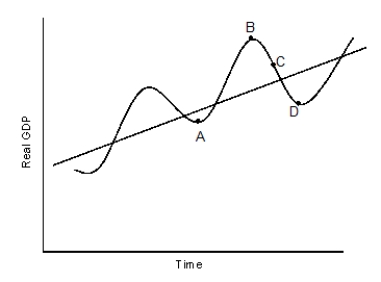
-Refer to Figure 7.1. The movement from point A to point B in the figure is most likely to be associated with _____.
A) negative inflation.
B) an increase in the aggregate demand for goods and services.
C) lagging economic productivity.
D) an increase in cyclical unemployment.
E) a downward trend in leading economic indicators.
Correct Answer:
Verified
Q3: Economists call a severe prolonged economic recession
Q16: Which of the following would be considered
Q18: Which of the following refers to business
Q19: The long-run growth in the economy depends
Q20: The official dating of recessions in the
Q21: Scenario 7.1?Of 1,350 people surveyed, 318 are
Q22: In the official labor statistics, discouraged workers
Q25: Which of the following statements about frictional
Q34: The effect of _ is to produce
Q39: Which of the following persons would be
Unlock this Answer For Free Now!
View this answer and more for free by performing one of the following actions

Scan the QR code to install the App and get 2 free unlocks

Unlock quizzes for free by uploading documents