The figure given below represents the demand and supply conditions of an economy.?Figure 7.3
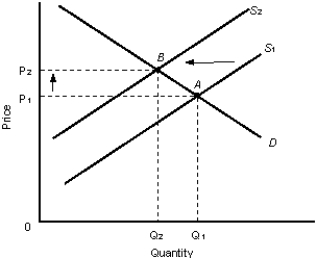
-Refer to Figure 7.3. Which of the following explains the shift in the supply curve from S₁ to S₂?
A) Decreases in oil supplies as experienced in the 1970s
B) Wage concessions by union members
C) Businesses reducing their profit margins
D) Discoveries of natural gas
E) Increased foreign demand for domestic products
Correct Answer:
Verified
Q84: Assume you borrow $1, 000 on credit
Q85: Which of the following could contribute to
Q88: When there is an upward rise in
Q90: Demand-pull inflation is caused:
A) by increases in
Q92: During a period of economic expansion, we
Q93: Which of the following is true of
Q95: In a business cycle, a peak marks
Q96: Assume that for a given year, the
Q99: Which of the following countries did not
Q100: If the nominal interest rate is 6.3
Unlock this Answer For Free Now!
View this answer and more for free by performing one of the following actions

Scan the QR code to install the App and get 2 free unlocks

Unlock quizzes for free by uploading documents