Each of the panels given below represents the short-run equilibrium in the U.S. economy. The Aggregate Demand and Aggregate Supply curves in each panel responds to various economic changes.
Figure 8.1
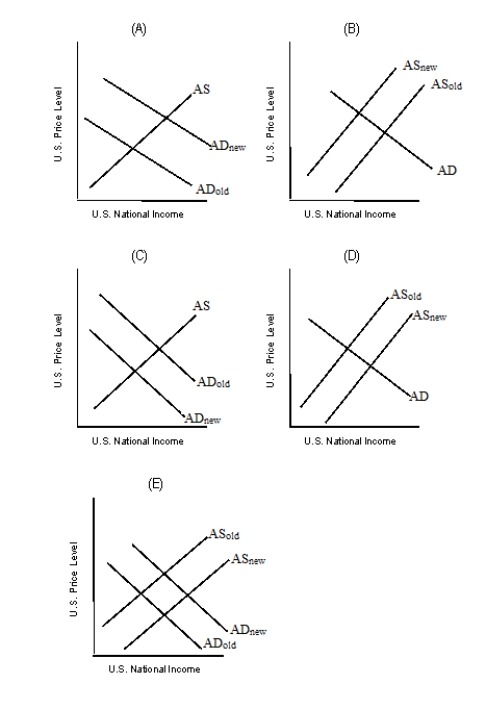
-Refer to Figure 8.1. Which of the graphs in the figure best describes the impact of lower real income in Germany on U.S. equilibrium real GDP and the U.S. equilibrium price level?
A) Panel A
B) Panel B
C) Panel C
D) Panel D
E) Panel E
Correct Answer:
Verified
Q65: Other things equal, an increase in aggregate
Q66: Identify the correct statement.
A)Aggregate demand alone determines
Q67: To determine short-run equilibrium in the economy,
Q72: The degree to which _ declines during
Q73: The figure given below represents the
Q75: A simultaneous increase in both unemployment and
Q76: Other things equal, an increase in aggregate
Q77: The intersection of the aggregate demand and
Q78: In the 1970s the international price of
Q79: Which of the following is true of
Unlock this Answer For Free Now!
View this answer and more for free by performing one of the following actions

Scan the QR code to install the App and get 2 free unlocks

Unlock quizzes for free by uploading documents