Each of the panels given below represents the short-run equilibrium in the U.S. economy. The Aggregate Demand and Aggregate Supply curves in each panel responds to various economic changes.
Figure 8.1
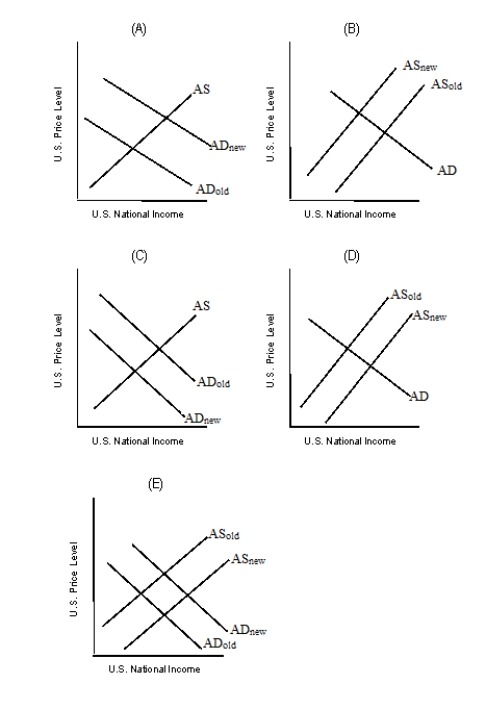
-Refer to Figure 8.1. Which of the graphs in the figure best describes the impact of an effective oil embargo that raises the price of gasoline?
A) Panel A
B) Panel B
C) Panel C
D) Panel D
E) Panel E
Correct Answer:
Verified
Q46: What happens to aggregate supply when production
Q52: Which of the following statements is true
Q54: In the short-run, an increase in the
Q57: The short-run aggregate supply curve will shift
Q63: Assume that the aggregate demand increases while
Q63: Each of the panels given below represents
Q64: Assume that the AD curve is held
Q71: A simultaneous increase in inflation and decrease
Q73: Other things equal, an increase in aggregate
Q75: A simultaneous increase in both unemployment and
Unlock this Answer For Free Now!
View this answer and more for free by performing one of the following actions

Scan the QR code to install the App and get 2 free unlocks

Unlock quizzes for free by uploading documents