The figure given below represents the long-run equilibrium in the aggregate demand and aggregate supply model.?Figure 8.2
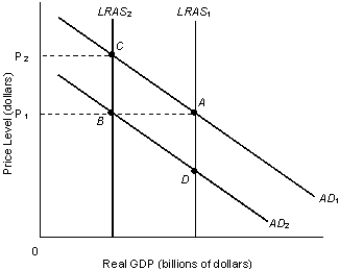
-Refer to Figure 8.2. Suppose major oil-exporting countries restrict oil output, thus increasing the price of oil. In the figure this would be represented by:
A) a movement from A to C.
B) a movement from A to B to C.
C) a movement from B to C.
D) a movement from B to A.
E) a movement from C to A.
Correct Answer:
Verified
Q81: The interest rate effect suggests that investment
Q89: Increased household spending reduces aggregate expenditures.
Q90: An increase in the real value of
Q91: The figure given below represents the equilibrium
Q95: The figure given below represents the equilibrium
Q96: A decrease in the relative price of
Q98: A lower domestic price level raises aggregate
Q100: In 2009, a nation reported total imports
Q105: When the actual inflation rate rises more
Q119: When the foreign price level falls, domestic
Unlock this Answer For Free Now!
View this answer and more for free by performing one of the following actions

Scan the QR code to install the App and get 2 free unlocks

Unlock quizzes for free by uploading documents