The figure given below represents the equilibrium real GDP and price level in the aggregate demand and aggregate supply model.?Figure 8.3
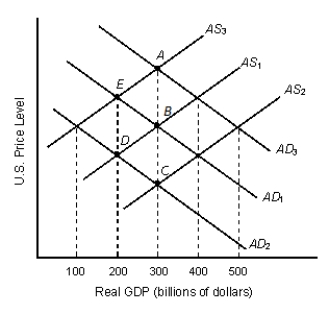
-Refer to Figure 8.3. If AS₁ and AD₁ represent the initial aggregate demand and supply in the economy, the long-run equilibrium real GDP will be _____ billion.
A) $100
B) $200
C) $300
D) $400
E) $500
Correct Answer:
Verified
Q69: Aggregate demand-aggregate supply analysis shows that in
Q76: Other things equal, an increase in aggregate
Q79: The figure given below represents the long-run
Q83: An increase in aggregate demand normally does
Q87: Government spending is set by the federal
Q91: The purchase of fifty new food-processing machines
Q92: The economic reasons that underlie the shape
Q93: The figure given below represents the equilibrium
Q93: A rightward shift in the aggregate supply
Q94: If there is a sudden jump in
Unlock this Answer For Free Now!
View this answer and more for free by performing one of the following actions

Scan the QR code to install the App and get 2 free unlocks

Unlock quizzes for free by uploading documents