The figure given below represents the leakages and injections in an economy.
Figure 10.3
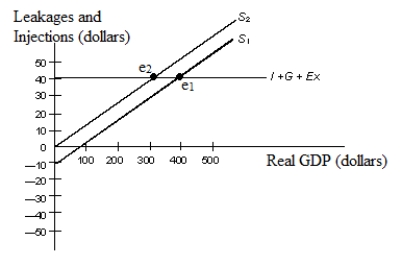 In the figure:
S1 and S2: Saving functions
I: Investment
G: Government spending
EX: Net exports
-Refer to Figure 10.3. The paradox of thrift might not be a problem if:
A) the average price level does not change in the short run.
B) the I + G + EX line were downward-sloping.
C) the I + G + EX line were constant at an intercept of $30.
D) the increase in saving was used to fund investment expenditures.
E) the I + G + EX line were constant at an intercept of $50.
Correct Answer:
Verified
Q19: The table given below states the
Q20: The table given below states the
Q22: The figure given below represents the leakages
Q25: Scenario 10.1
Imagine an economy that does not
Q27: The percentage of a change in income
Q27: Scenario 10.1
Imagine an economy that does not
Q29: Assume that an increase of $300 in
Q36: Suppose an economy has a government budget
Q37: The spending multiplier measures the change in
Q39: Suppose an economy operates at a real
Unlock this Answer For Free Now!
View this answer and more for free by performing one of the following actions

Scan the QR code to install the App and get 2 free unlocks

Unlock quizzes for free by uploading documents