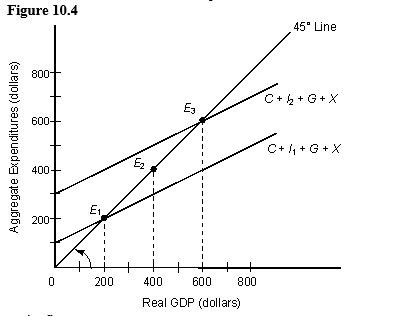
The figure given below represents the macroeconomic equilibrium in the aggregate income and aggregate expenditure framework. Assume that MPI is equal to zero.
-If the spending multiplier equals 5 and equilibrium income is $2 billion below potential GDP, then _____ to reach the potential real GDP level.
A) total spending needs to increase by $0.1 billion
B) nominal GDP needs to increase by $1.2 billion
C) total spending needs to decrease by $6 billion
D) nominal GDP needs to decrease by $12 billion
E) total spending needs to increase by $0.4 billion
Correct Answer:
Verified
Q61: Assume that potential GDP is $200 billion
Q62: The figure given below depicts macroeconomic equilibrium
Q64: The figure given below depicts macroeconomic equilibrium
Q66: The figure given below represents the macroeconomic
Q66: The table given below shows the
Q71: The figure given below represents the leakages
Q73: Calculate the marginal propensity to consume for
Q76: The figure given below represents the leakages
Q79: Calculate the spending multiplier from the information
Q80: The figure given below represents the macroeconomic
Unlock this Answer For Free Now!
View this answer and more for free by performing one of the following actions

Scan the QR code to install the App and get 2 free unlocks

Unlock quizzes for free by uploading documents