The figure given below represents the leakages and injections of an economy.
Figure 10.6
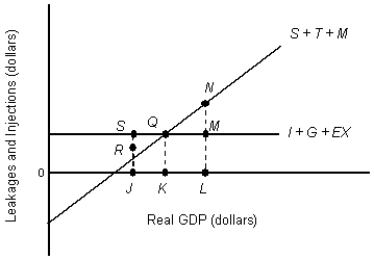
-In Figure 10.6, the economy is in equilibrium at point _____.
A) S
B) Q
C) N
D) R
E) M
Correct Answer:
Verified
Q71: Assume that a GDP gap can be
Q71: The figure given below represents the leakages
Q73: Calculate the marginal propensity to consume for
Q75: The figure given below represents the leakages
Q77: The figure given below depicts macroeconomic equilibrium
Q78: If the spending multiplier equals 5 and
Q78: The figure given below represents the macroeconomic
Q79: Calculate the spending multiplier from the information
Q80: The figure given below represents the macroeconomic
Q84: When the purchasing power of money declines:
A)demand
Unlock this Answer For Free Now!
View this answer and more for free by performing one of the following actions

Scan the QR code to install the App and get 2 free unlocks

Unlock quizzes for free by uploading documents