The figure given below shows the macroeconomic equilibria of a country.?Figure 11.1
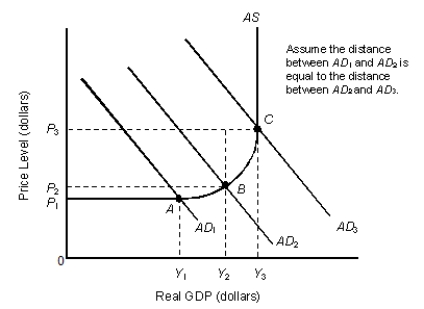
-Refer to Figure 11.1. A decrease in government spending would be most effective in reducing the price level if:
A) the economy were in equilibrium at point A.
B) the economy were in equilibrium at point B.
C) there is a rightward shift in the aggregate supply curve.
D) the economy were in equilibrium at point C.
E) there is a leftward shift in the aggregate supply curve.
Correct Answer:
Verified
Q1: The sum of the unemployment rate and
Q2: Fiscal policy is most effective in controlling
Q3: Suppose the equilibrium level of income exceeds
Q8: If the government wants to close a
Q14: The GDP gap is:
A) the product of
Q15: Calculate the government spending multiplier if, an
Q17: Which of the following can be categorized
Q18: When the government uses taxes and spending
Q19: Suppose the Congress enacts a 5 percent
Q20: The figure given below shows the macroeconomic
Unlock this Answer For Free Now!
View this answer and more for free by performing one of the following actions

Scan the QR code to install the App and get 2 free unlocks

Unlock quizzes for free by uploading documents