The figure given below depicts the equilibrium in the foreign exchange market.
Figure 13.1
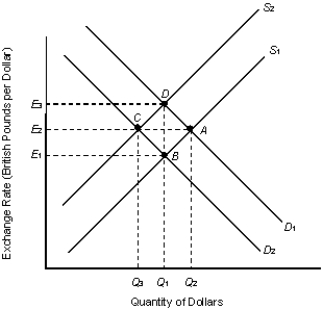
-Refer to Figure 13.1. Which of the following is most likely to cause equilibrium to change from point A to point D?
A) A decrease in U.S. demand for British goods and services
B) An increase in U.S. demand for British goods and services
C) An increase in the supply of dollars on the foreign exchange market
D) A decrease in the supply of British pounds on the foreign exchange market
E) An increase in British demand for U.S. exports
Correct Answer:
Verified
Q63: The figure given below depicts the equilibrium
Q65: The figure given below depicts the equilibrium
Q69: To keep the U.S.dollar from depreciating against
Q70: Assume that there is an unexpected increase
Q72: The figure given below depicts the equilibrium
Q73: Which of the following people is most
Q77: If the U.S.dollar depreciates against the yen
Q78: To fix the foreign currency price of
Q91: The desire to keep assets in cash
Q99: Suppose the U.S.dollar appreciates in value against
Unlock this Answer For Free Now!
View this answer and more for free by performing one of the following actions

Scan the QR code to install the App and get 2 free unlocks

Unlock quizzes for free by uploading documents