In the figure given below panel A represents money market equilibrium, panel B represents investment demand, and panel C represents equilibrium real GDP.
Figure 13.3
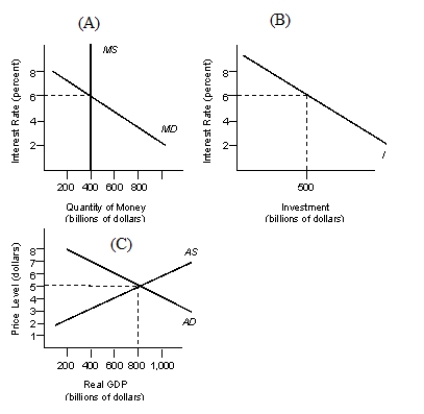
-Refer to Figure 13.3. When this economy is in equilibrium:
A) investment spending is equal to $800 billion.
B) the interest rate is equal to 4 percent.
C) there is an excess demand for money.
D) the price level will equal $5.
E) real GDP will equal $500 billion.
Correct Answer:
Verified
Q83: If a bond pays a fixed return
Q92: If a bond pays 11.5 percent interest
Q94: A leftward shift in the money demand
Q94: Scenario 13.1
Assume the following conditions hold.
a.At all
Q95: An increase in nominal income will result
Q98: Assume the economy is in equilibrium as
Q105: As the velocity of money rises, the
Q108: The velocity of circulation of money is
Q112: All members of the Federal Board of
Q124: The "secondary credit" of the discount rate
Unlock this Answer For Free Now!
View this answer and more for free by performing one of the following actions

Scan the QR code to install the App and get 2 free unlocks

Unlock quizzes for free by uploading documents