The figure given below depicts the equilibrium level of real GDP and the price level in an economy, derived from the aggregate demand aggregate supply model.
Figure 14.3
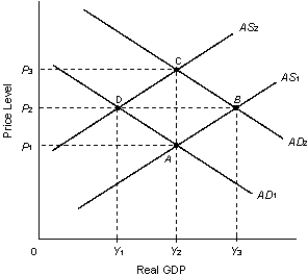
-Refer to Figure 14.3. Consider that the economy initially operates at point A. Therefore, according to the theory of rational expectations, an unanticipated increase in consumer confidence will cause the economy to move along the path:
A) ADC.
B) AC.
C) ABDC.
D) AD.
E) ABC.
Correct Answer:
Verified
Q41: Assume that a low-wage contract is in
Q42: Suppose that the economy has witnessed an
Q45: A recessionary real shock will:
A)shift the aggregate
Q47: If the public expects the incumbent administration
Q48: Critics of the Federal Reserve maintain that,
Q50: The business cycle that results from the
Q54: To some economists, the "great moderation" means:
A)small
Q64: Monetary reform is a new monetary policy
Q74: Government spending can be financed by all
Q76: The change in the money supply in
Unlock this Answer For Free Now!
View this answer and more for free by performing one of the following actions

Scan the QR code to install the App and get 2 free unlocks

Unlock quizzes for free by uploading documents