The figure given below shows the supply curves with different slopes.?Figure 15.1
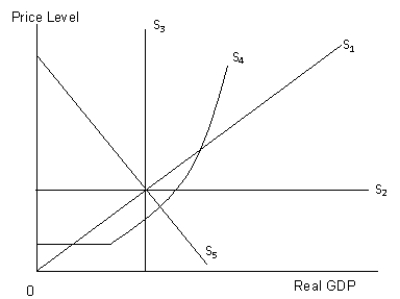
-Refer to Figure 15.1. Which of the following supply curves represent the supply curve in the simple Keynesian model?
A) S₁
B) S₂
C) S₃
D) S₄
E) S₅
Correct Answer:
Verified
Q3: Which of the following schools of thought
Q6: Which of the following would explain wage
Q7: The flat region of the aggregate supply
Q7: Which of the following schools of thought
Q8: In the fixed-price Keynesian model, what would
Q8: Which of the following is true from
Q11: Which of the following macroeconomic schools of
Q13: The figure given below shows the supply
Q17: If the traditional Keynesian views turn out
Q19: According to new Keynesian economics:
A)the aggregate supply
Unlock this Answer For Free Now!
View this answer and more for free by performing one of the following actions

Scan the QR code to install the App and get 2 free unlocks

Unlock quizzes for free by uploading documents