The figure given below represents the new classical long run and short run Phillips curve measuring inflation rate on vertical axis and unemployment rate on horizontal axis.
Figure 15.2
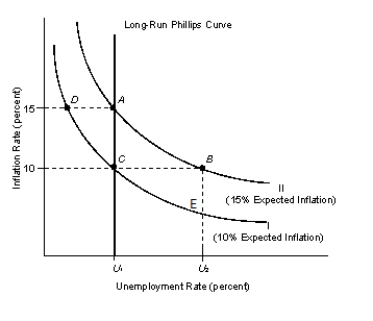
-Refer to the Figure 15.2. If the actual inflation rate is 15 percent and the expected inflation rate was 10 percent, the economy must currently be at:
A) point A.
B) point B.
C) point C.
D) point D.
E) point E.
Correct Answer:
Verified
Q41: Assume that workers have perfect information about
Q42: Which of the following economic theories takes
Q44: New classical economists believe that:
A)market failure on
Q47: The figure given below represents the new
Q48: The figure given below represents the new
Q50: _ is the theory that was popular
Q52: According to new classical school of economics,
Q53: The figure given below represents the new
Q53: An economist from which school of thought
Q55: Traditional classical economists believe that:
A)wage rates are
Unlock this Answer For Free Now!
View this answer and more for free by performing one of the following actions

Scan the QR code to install the App and get 2 free unlocks

Unlock quizzes for free by uploading documents