The figure below shows the demand (D) and supply (S) curves of a good produced domestically in an economy as well as traded in the international market.?Figure 20.1??In the figure,?P₁: Price of the good in the international market.?P₂: Price of the good in the domestic market after the imposition of tariff by the government.?P₃: No-trade price of the good in the domestic market.
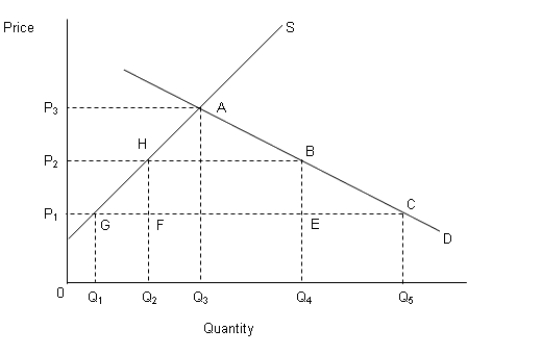
-Refer to Figure 20.1. If the government imposes a tariff such that the price of the good in the domestic market is P₂ when the international price is P₁:
A) the import of the good by the domestic country increases by Q₅ - Q₄ units.
B) the import of the good by the domestic country declines.
C) the quantity of the good exported by the domestic country declines.
D) the domestic country is in equilibrium.
E) the quantity of the good exported by the domestic country increases.
Correct Answer:
Verified
Q4: Typically,restrictions to "save domestic jobs" simply redistribute
Q14: The infant industry argument is that:
A)those industries
Q22: Suppose the production of helicopters is an
Q23: The figure below shows the demand (D)
Q24: The table below shows the quantity demanded
Q26: If average costs of production decline with
Q30: The table below shows the quantity demanded
Q33: The table below shows the quantity demanded
Q36: According to strategic trade policy,international trade largely
Q36: The table below shows the quantity demanded
Unlock this Answer For Free Now!
View this answer and more for free by performing one of the following actions

Scan the QR code to install the App and get 2 free unlocks

Unlock quizzes for free by uploading documents