The figure given below depicts the demand and supply of Brazilian reals in the foreign exchange market. Assume that the market operates under a flexible exchange rate regime.?Figure 21.1??In the figure:?D₁ and D₂: Demand for Brazilian reals?S₁ and S₂: Supply of Brazilian reals
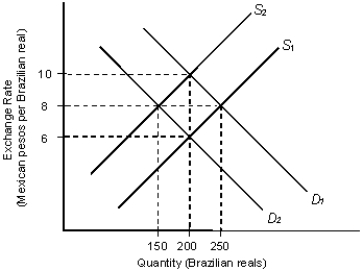
-Refer to Figure 21.1. Determine the equilibrium exchange rate and equilibrium quantity of Brazilian reals, if D₁ and S₁ are the relevant demand and supply curves for Brazilian reals in this market.
A) 10 pesos per real and a quantity of 150 reals
B) 6 pesos per real and a quantity of 250 reals
C) 8 pesos per real and a quantity of 150 reals
D) 8 pesos per real and a quantity of 250 reals
E) 6 pesos per real and a quantity of 200 reals
Correct Answer:
Verified
Q1: The figure below shows the demand (D)
Q10: The figure below shows the demand (D)
Q16: The figure below shows the demand (D)
Q23: Equilibrium in the foreign exchange market occurs:
A)at
Q28: The figure below shows the demand (D)
Q31: The figure below shows the demand (D)
Q32: When the exchange rate fluctuates around a
Q32: The figure below shows the demand (D)
Q37: The figure below shows the demand (D)
Q40: The figure below shows the demand (D)
Unlock this Answer For Free Now!
View this answer and more for free by performing one of the following actions

Scan the QR code to install the App and get 2 free unlocks

Unlock quizzes for free by uploading documents