Narrbegin Exhibit 3.2 Demand curves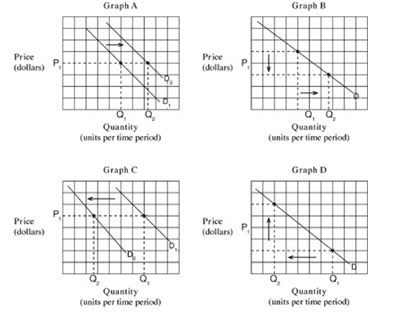
-Which of the graphs in Exhibit 3.2 depicts the effect of a reduction in the price of iPhones on the demand for the iPhones?
A) Graph A.
B) Graph B.
C) Graph C.
D) Graph D.
Correct Answer:
Verified
Q14: Narrbegin Exhibit 3.1 Market demand 
Q15: If the price of potato chips increases,
Q16: The relationship between price and quantity demanded:
A)
Q17: Demand is a relationship between two economic
Q20: The fact that price and quantity demanded
Q21: Suppose that X and Y are complementary
Q22: Assuming that new cars are a normal
Q23: If consumer incomes go up and laptops
Q24: There is news that the price of
Q64: Suppose that X and Y are substitute
Unlock this Answer For Free Now!
View this answer and more for free by performing one of the following actions

Scan the QR code to install the App and get 2 free unlocks

Unlock quizzes for free by uploading documents