Exhibit 3-3 Supply curves
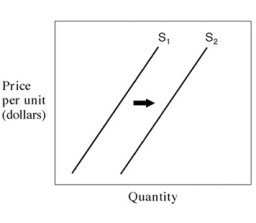
-In Exhibit 3-3,which of the following could have caused the shift in the supply curve from S₁ to S₂?
A) Increase in demand.
B) Decrease in demand.
C) Decrease in the number of suppliers in the market.
D) Increase in the number of sellers.
E) Increase in the cost of materials.
Correct Answer:
Verified
Q55: Farmers can choose to produce eggs and/or
Q57: Which of the following factors do not
Q58: A leftward shift of a supply curve
Q61: Equilibrium occurs:
A)at any price for which quantity
Q62: If government introduces a new subsidy to
Q64: Innisfail banana farmers said that they lost
Q67: Which of the following will not cause
Q189: A decrease in supply means that:
A) demand
Q195: The supply curve reflects the:
A) inverse relationship
Q212: If more people enter medical school, we
Unlock this Answer For Free Now!
View this answer and more for free by performing one of the following actions

Scan the QR code to install the App and get 2 free unlocks

Unlock quizzes for free by uploading documents