Exhibit 3-7 Supply and demand curves
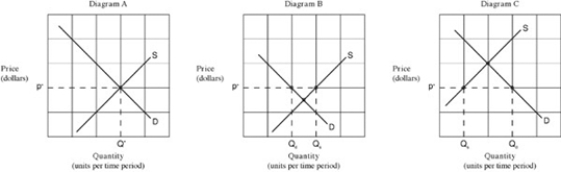
-Which of the graphs in Exhibit 3-7 illustrates a surplus existing at the indicated market price?
A) Graph A.
B) Graph B.
C) Graph C.
D) Graphs A and C.
Correct Answer:
Verified
Q84: If quantity supplied is greater than the
Q92: Exhibit 3-6 Demand and supply curves
Q94: Exhibit 3-4 Demand and supply curves
Q95: When the price of a good in
Q96: Surplus (of a good) is a situation
Q98: A market:
A)is defined as a local market
Q100: A shortage of wheat:
A)is impossible if people
Q102: The major non-price determinants of demand for
Q109: Which of the following would shift the
Q266: Which of the following is true about
Unlock this Answer For Free Now!
View this answer and more for free by performing one of the following actions

Scan the QR code to install the App and get 2 free unlocks

Unlock quizzes for free by uploading documents