Exhibit 3-7 Supply and demand curves
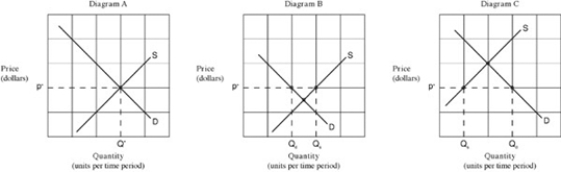
-Which of the graphs in Exhibit 3-7 illustrates a shortage existing at the indicated market price?
A) Graph A.
B) Graph B.
C) Graph C.
D) Graphs A and B.
Correct Answer:
Verified
Q65: If people expect the price of packaged
Q101: If goods X and Y are complements,
Q107: A shortage occurs when a good is
Q113: When firms advertise their products,they are attempting
Q117: An increase in supply is reflected as
Q118: A shortage is a market condition existing
Q119: A shift of the demand curve occurs
Q120: Other things being equal, a fall in
Q326: The supply curve for chicken will shift
Q336: A surplus means that the quantity supplied
Unlock this Answer For Free Now!
View this answer and more for free by performing one of the following actions

Scan the QR code to install the App and get 2 free unlocks

Unlock quizzes for free by uploading documents