Exhibit 4-2 Supply and demand curves
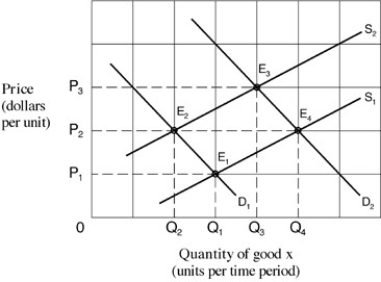
-The market shown in Exhibit 4-2 is initially in equilibrium at E₃.Changes in market conditions result in a new equilibrium at E₄.This change is stated as a/an:
A) increase in demand and an increase in supply.
B) decrease in demand and a decrease in quantity supplied.
C) increase in quantity demanded and an increase in quantity supplied.
D) decrease in supply and a decrease in quantity demanded.
E) increase in supply and an increase in quantity demanded.
Correct Answer:
Verified
Q19: Narrbegin Exhibit 4.1 Supply and demand
Q21: Suppose the government sets a price ceiling.
Q23: Exhibit 4-2 Supply and demand curves
Q24: Exhibit 4-2 Supply and demand curves
Q25: Exhibit 4-4 Demand and supply curves
Q25: There was an extensive black market (illegal
Q30: Price ceilings are imposed if the government:
A)
Q30: Rent controls can result in:
A)increasing rents received
Q31: Price ceiling is:
A) any price above market
Q36: If the government imposes a price ceiling
Unlock this Answer For Free Now!
View this answer and more for free by performing one of the following actions

Scan the QR code to install the App and get 2 free unlocks

Unlock quizzes for free by uploading documents