Exhibit 4-4 Demand and supply curves
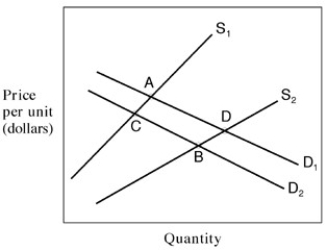
-In Exhibit 4-4,a movement from A to B is best explained by:
A) an increase in income and in the number of suppliers.
B) an increase in the price of complements and an increase in the price of inputs.
C) an increase in income and a decrease in the number of producers.
D) a decrease in income and an improvement in the technology used to produce the good.
E) an increase in the number of suppliers and a decrease in price of substitutes.
Correct Answer:
Verified
Q7: Narrbegin Exhibit 4.1 Supply and demand
Q25: There was an extensive black market (illegal
Q33: If the equilibrium price of good X
Q37: Exhibit 4-4 Demand and supply curves
Q39: Exhibit 4-3 Demand and supply curves
Q40: Exhibit 4-3 Demand and supply curves
Q46: If the government imposes a price ceiling
Q50: Price floors are instituted because the government
Q59: Narrbegin Exhibit 4.5 Supply and demand
Q98: If the government imposes a price ceiling,
Unlock this Answer For Free Now!
View this answer and more for free by performing one of the following actions

Scan the QR code to install the App and get 2 free unlocks

Unlock quizzes for free by uploading documents