Different scales of production
Exhibit 6-9 Cost curves
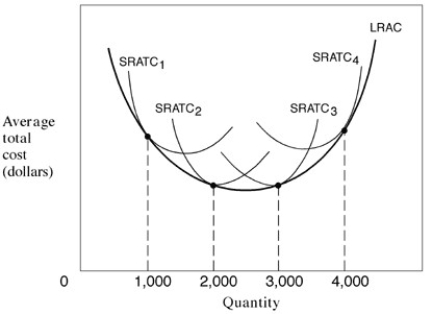
-In Exhibit 6-9,the U-shaped LRAC curve indicates which of the following as quantity increases from 0 to 4000?
A) Diseconomies of scale; constant returns to scale; economies of scale.
B) Constant returns to scale; economies of scale; diseconomies of scale.
C) Economies of scale; constant returns to scale; diseconomies of scale.
D) Diseconomies of scale; economies of scale; constant returns to scale.
E) Economies of scale; diseconomies of scale; constant returns to scale.
Correct Answer:
Verified
Q99: Which of the following statements is possible?
A)AVC
Q100: The law of diminishing returns explains why:
A)when
Q102: Exhibit 6-11 Long-run average cost curves
Q104: A zero economic profit is the same
Q107: The marginal curve determines the L-shape of
Q108: The law of diminishing marginal returns causes
Q108: If the total variable cost of producing
Q110: Which of the following is not a
Q115: Narrbegin Exhibit 6.10 Long-run average cost
Q190: The decreasing portion of a firm's long
Unlock this Answer For Free Now!
View this answer and more for free by performing one of the following actions

Scan the QR code to install the App and get 2 free unlocks

Unlock quizzes for free by uploading documents