Figure 14.2 The US Market for Imported Toyotas 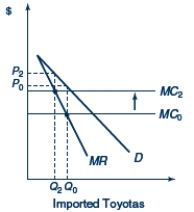
-In Figure 14.2,D represents the US demand curve for Toyotas and MC0 represents the marginal cost of producing Toyotas.A shift in the marginal cost curve from MC0 to MC2 represents
A) an appreciation of the dollar relative to the yen
B) a depreciation of the yen relative to the dollar
C) a depreciation of the dollar relative to the yen
D) neither an appreciation nor a depreciation of the dollar relative to the yen
Correct Answer:
Verified
Q52: Table 14.1.Hypothetical Costs of Producing an Automobile
Q53: Figure 14.1 US market for Imported Toyotas
Q56: According to the absorption approach (B =
Q57: The effect of currency depreciation on the
Q58: Table 14.1.Hypothetical Costs of Producing an Automobile
Q59: According to the J-curve effect,currency appreciation:
A) Decreases
Q59: Figure 14.1 US market for Imported Toyotas
Q60: According to the J-curve effect,currency depreciation:
A) Decreases
Q78: Appreciation of the dollar's exchange value worsens
Q79: The purpose of currency revaluation is to
Unlock this Answer For Free Now!
View this answer and more for free by performing one of the following actions

Scan the QR code to install the App and get 2 free unlocks

Unlock quizzes for free by uploading documents