
The diagram below represents the exchange market position of the United States in trade with the United Kingdom.Starting at the equilibrium exchange rate of $3 per pound,suppose the demand for pounds rises from D0 to D1.
Figure 17.1 Foreign Exchange Market
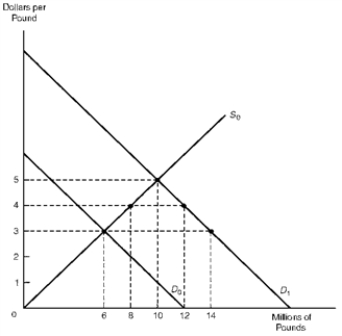
-Refer to Figure 17.1.If the exchange rate was allowed to rise to $4 per pound,U.S.monetary authorities would have to supply 6 million pounds to the foreign exchange market in exchange for dollars to maintain this rate.
Correct Answer:
Verified
Q36: Which term best describes the process in
Q37: Which indicator of international debt burden schedules
Q38: In response to the international debt problem,the
Q39: Debt reduction
A) Refers to any voluntary scheme
Q40: Bilateral agreements between central banks,which provide for
Q42: The diagram below represents the exchange market
Q43: International reserves allow a country to finance
Q44: When exchange rates are fixed by central
Q45: The demand for international reserves tend to
Q46: The demand for international reserves is negatively
Unlock this Answer For Free Now!
View this answer and more for free by performing one of the following actions

Scan the QR code to install the App and get 2 free unlocks

Unlock quizzes for free by uploading documents