Consider the clustered bar chart of the dashboard developed to monitor the performance of a call center: 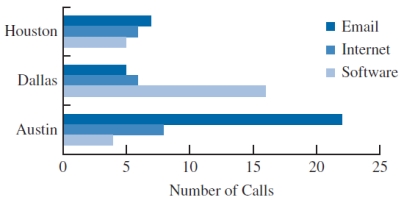
This chart allows the IT manager to
A) identify a particular type of problem by the call volume.
B) identify a particular type of problem by location.
C) identify different types of problems (Email, Internet, or Software) in the call center.
D) identify the frequency of each problem in the call center.
Correct Answer:
Verified
Q37: A useful chart for displaying multiple variables
Q38: A PivotChart, in few instances, is same
Q39: To avoid problems in interpreting the differences
Q40: In a business, the values indicating the
Q41: Consider the below data on 30 different
Q43: Growth is the primary focus for all
Q44: A consumer electronics company, after three months
Q45: The project lead in an MNC decides
Q46: A local search service company surveys on
Q47: A survey on the average pass percentage
Unlock this Answer For Free Now!
View this answer and more for free by performing one of the following actions

Scan the QR code to install the App and get 2 free unlocks

Unlock quizzes for free by uploading documents