Consider the below table and the line chart on the temperatures in 11 different states of the United States:

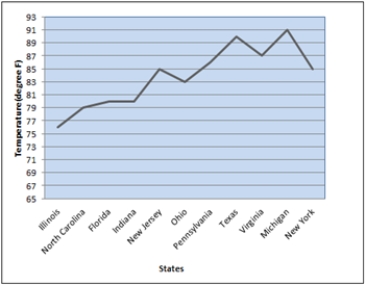
a. What are the problems with the layout and display of this line chart?
b. Create a new line chart for the given data. Format the chart to make it easy to read and interpret.
Correct Answer:
Verified
View Answer
Unlock this answer now
Get Access to more Verified Answers free of charge
Q45: The project lead in an MNC decides
Q46: A local search service company surveys on
Q47: A survey on the average pass percentage
Q48: The data on the scores obtained by
Q49: The data on the distance walked per
Q51: The following table shows the average monthly
Q52: The data on the ranks assigned to
Q53: A research was conducted on a sample
Q54: The following table is an example on
Q55: Consider the following survey results regarding marital
Unlock this Answer For Free Now!
View this answer and more for free by performing one of the following actions

Scan the QR code to install the App and get 2 free unlocks

Unlock quizzes for free by uploading documents