Exhibit 7.1
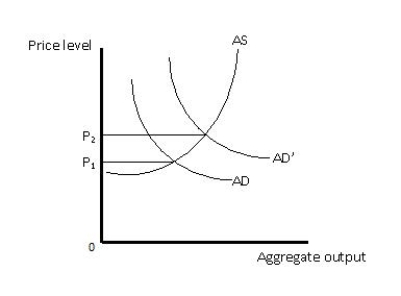
-Refer to Exhibit 7.1, which shows the aggregate demand and aggregate supply curves of an economy. In the graph below, the rise in the price levels from P₁ to P₂ is a result of _____
A) cost-pull inflation.
B) cost-push inflation.
C) demand-push inflation.
D) demand-pull inflation.
E) induced inflation.
Correct Answer:
Verified
Q61: One of the most widely reported measures
Q74: Cost-push inflation:
A)occurs when the aggregate demand curve
Q76: The consumer price index measures:
A)the cost of
Q84: Since the end of World War II,the
Q112: Suppose inflation is expected to be 5
Q113: If the CPI in the United States
Q114: Since World War II, the consumer price
Q117: Suppose inflation is expected to be 5
Q118: Inflation rates differ across regions mostly because
Q121: Which of the following is likely to
Unlock this Answer For Free Now!
View this answer and more for free by performing one of the following actions

Scan the QR code to install the App and get 2 free unlocks

Unlock quizzes for free by uploading documents